
PREPARED BY: Communications Department
DATE: January 22, 2025
SUBJECT: December 15, 2024 - January 14, 2025, Communications Update
BACKGROUND/PURPOSE:
Provide regular marketing and communication updates to the Board of Health.
| SOURCE | December 15 – January 14 | November 15 – December 14 | DIFFERENCE |
|---|---|---|---|
| News Releases, Media Advisories and Statements, or Notices Issued | 0 | 1 | -1 |
| Media Requests Received | 12 | 2 | 10 |
| Wechu.org pageviews | 79,442 | 79,941 | -499 |
| YouTube Channel Subscribers | 1,808 | 1,801 | 7 |
| Email Subscribers | 6,927 | 6,964 | -37 |
| Emails Distributed | 6 | 6 |
|
| Facebook Fans | 19,511 | 19,513 | -2 |
| Facebook Posts | 53 | 67 | -14 |
| Twitter Followers | 8,482 | 8,487 | -5 |
| Twitter Posts | 52 | 68 | -16 |
| Instagram Followers | 1,869 | 1,845 | 24 |
| Instagram Posts | 26 | 28 | -2 |
| LinkedIn Followers | 1,826 | 1,816 | 10 |
| LinkedIn Posts | 8 | 9 | -1 |
| Media Exposure | 36 | 45 | -9 |
Data Notes can be provided upon request.
Media Exposure Overview Graph
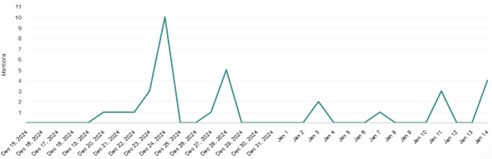
Notes: From December 15 – January 14, we experienced two main peaks in media exposure:
December 24 – A handful of media reached out to us for interviews regarding the avian flu following a social post issued by Wings Rehabilitation Center having positive cases in some of their birds.
December 28 – Media stories covered an increase in police in the Glengarry neighbourhood, in which the WECHU was mentioned for our involvement in an event where 355 drug testing strips were distributed along with other supportive health information.
Website Overview Graph
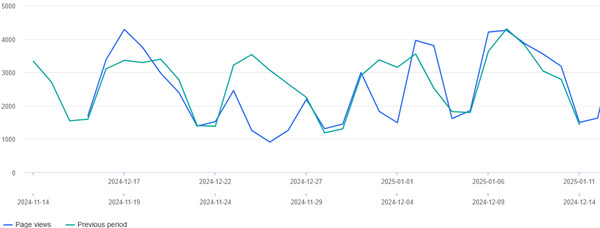
Notes: From December 15 – January 14, we saw very similar website traffic patterns as the previous month, but at a lower volume. This can be explained by the fact we didn’t issue any news releases which commonly drive higher volumes of traffic to our site, and the holiday timeframe tends to show quieter traffic volumes.
Social Media Overview Graph
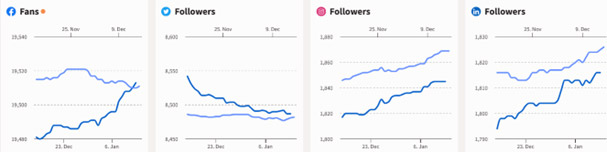
Lighter blue line represents the current month, darker blue line represents the previous month. Notes: Our follower counts stayed relatively consistent from the previous month.