
PREPARED BY: Communications Department
DATE: December 17, 2024
SUBJECT: November 15, 2023 – December 14, 2024, Communications Update
BACKGROUND/PURPOSE:
Provide regular marketing and communication updates to the Board of Health.
| SOURCE | November 15 – December 14 | October 15 – November 14 | DIFFERENCE |
|---|---|---|---|
| News Releases, Media Advisories and Statements, or Notices Issued | 1 | 7 | -6 |
| Media Requests Received | 2 | 8 | -6 |
| Wechu.org pageviews | 79,941 | 103,564 | -23,623 |
| YouTube Channel Subscribers | 1,801 | 1,792 | 9 |
| Email Subscribers | 6,964 | 6,969 | -5 |
| Emails Distributed | 6 | 9 | -3 |
| Facebook Fans | 19,513 | 19,480 | 33 |
| Facebook Posts | 67 | 73 | -6 |
| Twitter Followers | 8,487 | 8,555 | -68 |
| Twitter Posts | 68 | 72 | -4 |
| Instagram Followers | 1,845 | 1,815 | 30 |
| Instagram Posts | 28 | 29 | -1 |
| LinkedIn Followers | 1,816 | 1,795 | 21 |
| LinkedIn Posts | 9 | 19 | -10 |
| Media Exposure | 45 | 92 | -47 |
Data Notes can be provided upon request.
Media Exposure Overview Graph
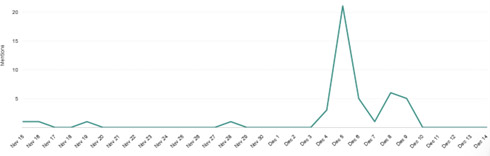
Notes: From November 15 – December 14, we experienced two peaks in media exposure:
December 5 – A story was published that addressed a rise in cases of walking pneumonia across Ontario. The WECHU was mentioned with our case count pulled from our online data dashboard, but our cases were significantly lower than other regions.
December 8 – 9 – Following the December Board of Health meeting, a handful of stories were published including cases of West Nile Virus, the 2025 budget, and protecting yourself from seasonal respiratory illnesses.
Website Overview Graph
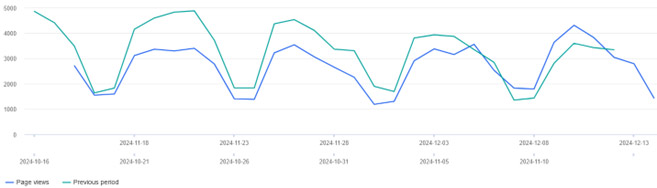
Notes: From November 15 – December 14, we saw very similar website traffic patterns as the previous month, but at a lower volume. This can be explained by the fact we didn’t issue any news releases which commonly drive higher volumes of traffic to our site.
Social Media Overview Graph
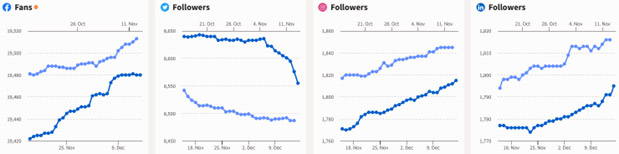
Lighter blue line represents the current month, darker blue line represents the previous month. Notes: We continue to see growth on Meta platforms where the WECHU has had a large volume of paid campaigns and boosted posts to reach users outside of our Followers.
Discussion - Mental Health Campaign

The Communications Department worked with the Chronic Disease & Injury Prevention Department on a mental health awareness campaign. The campaign was multi-faceted, with components running in-market from mid-October until the end of November.
The campaign consisted of eight boosted social media posts on Meta (i.e., Facebook and Instagram), as well as ads on Google, Facebook, and Transit Windsor (interior bus ads).
The goal of the ads was two-fold, to drive traffic to the mental health pages on wechu.org, and to raise awareness of ways to promote one’s mental health. The two webpages generated a total of 2,166 views over the course of the campaign. The Google ad was displayed on screens 30,764 times with the link receiving 958 clicks, and the Facebook ad reached 26,579 users on the platform with the link receiving 466 clicks.