
PREPARED BY: Communications Department
DATE: August 23, 2024
SUBJECT: July 15, 2024 - August 14, 2024, Communications Update
BACKGROUND/PURPOSE:
Provide regular marketing and communication updates to the Board of Health.
| SOURCE | July 15 – August 14 | June 15 – July 14 | DIFFERENCE |
|---|---|---|---|
| News Releases, Media Advisories and Statements, or Notices Issued | 12 | 9 | 3 |
| Media Requests Received | 9 | 6 | 3 |
| Wechu.org pageviews | 128,126 | 96,921 | 32,205 |
| YouTube Channel Subscribers | 1,780 | 1,777 | 3 |
| Email Subscribers | 7,007 | 7,044 | -37 |
| Emails Distributed | 14 | 13 | 1 |
| Facebook Fans | 19.398 | 19,301 | 97 |
| Facebook Posts | 72 | 67 | 5 |
| Twitter Followers | 8,658 | 8,656 | 2 |
| Twitter Posts | 74 | 68 | 6 |
| Instagram Followers | 1,702 | 1,689 | 13 |
| Instagram Posts | 37 | 33 | 4 |
| LinkedIn Followers | 1,756 | 1,746 | 10 |
| LinkedIn Posts | 12 | 9 | 3 |
| Media Exposure | 124 | 110 | 14 |
Data Notes can be provided upon request.
Media Exposure Overview Graph
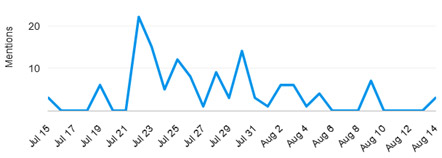
Notes: From July 15 – August 14, we experienced two peaks of media exposure:
July 22 – 25 – During this timeframe, three News Releases were issued that drew high media interest, including a positive rabies test in a bat, a warning of blue-green algae, and the kickoff event of KI Pill distribution. Between these days, a total of 54 stories were published.
July 30 – On this day, a follow up release was issued on the blue-green algae bloom with safety measures for residents, resulting in 14 stories.
Website Overview Graph
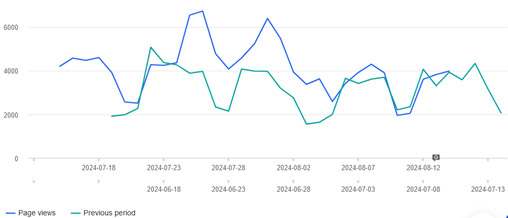
Notes: From July 15 – August 14, we saw increased website traffic patterns as the previous month. Throughout the summer months, our beach water testing results drive a large volume of users to our webpage.
Social Media Overview Graph
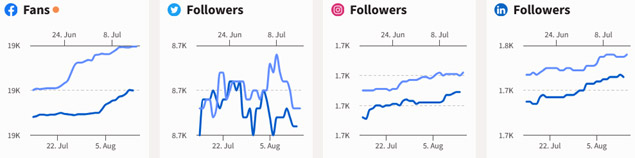
Lighter blue line represents the current month, darker blue line represents the previous month.
Notes: We saw a large increase in Fans on Facebook in the current timeframe (+97). Throughout this timeframe, there were a number of campaigns with boosted posts across various topics, which may account for the increase in Fans as these posts reach people outside our followers.
Discussion - Physical Activity Promotion Campaign


Throughout the summer, the Communications Department worked with the Chronic Disease and Injury Prevention Department to promote a variety of messages around physical activity. The messages ranged from promoting active travel (e.g., walking or biking instead of driving), the benefits of being physically active as you age, ways to integrate movement into daily tasks, and getting enough sleep to have the energy to be active.
The campaign included a series of boosted posts (pictured above) on the Meta platform (Facebook and Instagram). Each post was boosted with $50 and ran for seven days. In total, the posts received the following metrics:
| Metric | Value |
|---|---|
| Impressions | 61,374 |
| Reach | 27,830 |
| Reactions | 87 |
| Link clicks | 693 |
Impressions = The number of times the content was displayed on a screen (could include the same user seeing it on different screens / at different times)
Reach = The number of unique users who saw the post
Reactions = The number of people who added a reaction (e.g., thumbs up, heart, mad emoticons)
Link clicks = The number of times the URL on the ad was clicked