
PREPARED BY: Communications Department
DATE: July 19, 2024
SUBJECT: June 15, 2024 - July 14, 2024, Communications Update
BACKGROUND/PURPOSE:
Provide regular marketing and communication updates to the Board of Health.
| SOURCE | June 15 – July 14 | May 15 – June 14 | DIFFERENCE |
|---|---|---|---|
| News Releases, Media Advisories and Statements, or Notices Issued | 9 | 6 | 3 |
| Media Requests Received | 6 | 12 | -6 |
| Wechu.org pageviews | 96,921 | 91,369 | 5,552 |
| YouTube Channel Subscribers | 1,777 | 1,774 | 3 |
| Email Subscribers | 7,044 | 7,092 | -48 |
| Emails Distributed | 13 | 14 | -1 |
| Facebook Fans | 19,301 | 19,241 | 60 |
| Facebook Posts | 67 | 81 | -14 |
| Twitter Followers | 8,656 | 8,654 | 2 |
| Twitter Posts | 68 | 83 | -15 |
| Instagram Followers | 1,689 | 1,671 | 18 |
| Instagram Posts | 33 | 41 | -8 |
| LinkedIn Followers | 1,746 | 1,736 | 10 |
| LinkedIn Posts | 9 | 13 | -4 |
| Media Exposure | 110 | 87 | 23 |
Data Notes can be provided upon request.
Media Exposure Overview Graph
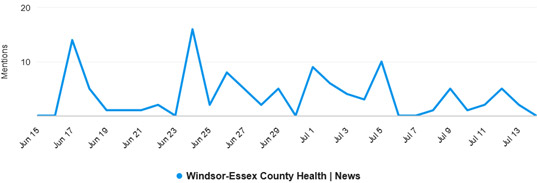
Notes: From June 15 – July 14, we experienced 2 main peaks of media exposure:
June 17 – Following an extended heat alert issued by Environment and Climate Change Canada, WECHU communicated the alert via email and social media, resulting in 8 stories related to heat and heat-related illness.
June 24 – 25 – Between these two dates there were three main stories that attracted media attention. The extended heat alert ended, a mosquito pool tested positive for West Nile Virus, and a WECOSS alert was issued due to a high number of overdoses.
Website Overview Graph
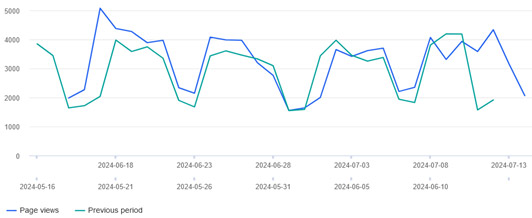
Notes: From June 15 – July 14, we saw an increase in web traffic which could be attributed to three news releases which attracted a lot of attention and drove traffic to our website (i.e., an extended heat alert and a mosquito pool that tested positive for West Nile Virus).
Social Media Overview Graph
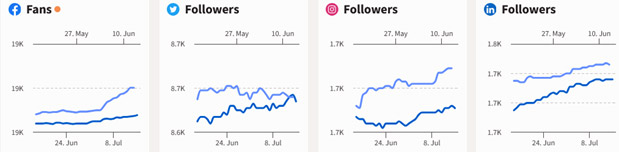
Lighter blue line represents the current month, darker blue line represents the previous month.
Overall, we saw increases in our followers, with a noticeable increase on Meta (Facebook & Instagram). This could be due to the number of paid campaigns (e.g., boosted posts) that have been in market recently.
Discussion - Break the Vape Challenge
The final component of the Break the Vape public service challenge consisted of a multi-faceted paid marketing campaign. The Communications Department worked with the Healthy Schools Department to develop a plan to promote the top three videos in both age categories once the public voting ended (six winning videos total).
A news release was issued on May 3, 2024, to announce the six winning videos. This resulted in 3 media outlets publishing stories for a total of 5 news stories.
The six videos were launched as paid ads on Meta (Facebook and Instagram social media platforms) and Google, which drove traffic to the video either on YouTube or the Break the Vape webpage on the WECHU’s website. Each video ad ran for one week.
Through these ads, in total, the six videos have received nearly 28,000 views on YouTube. On Facebook and Instagram, the ads generated over 352,000 views, resulting in almost 6,500 visits to the Break the Vape webpage. Throughout the campaign timelines, the Break the Vape webpage had just over 10,000 views.